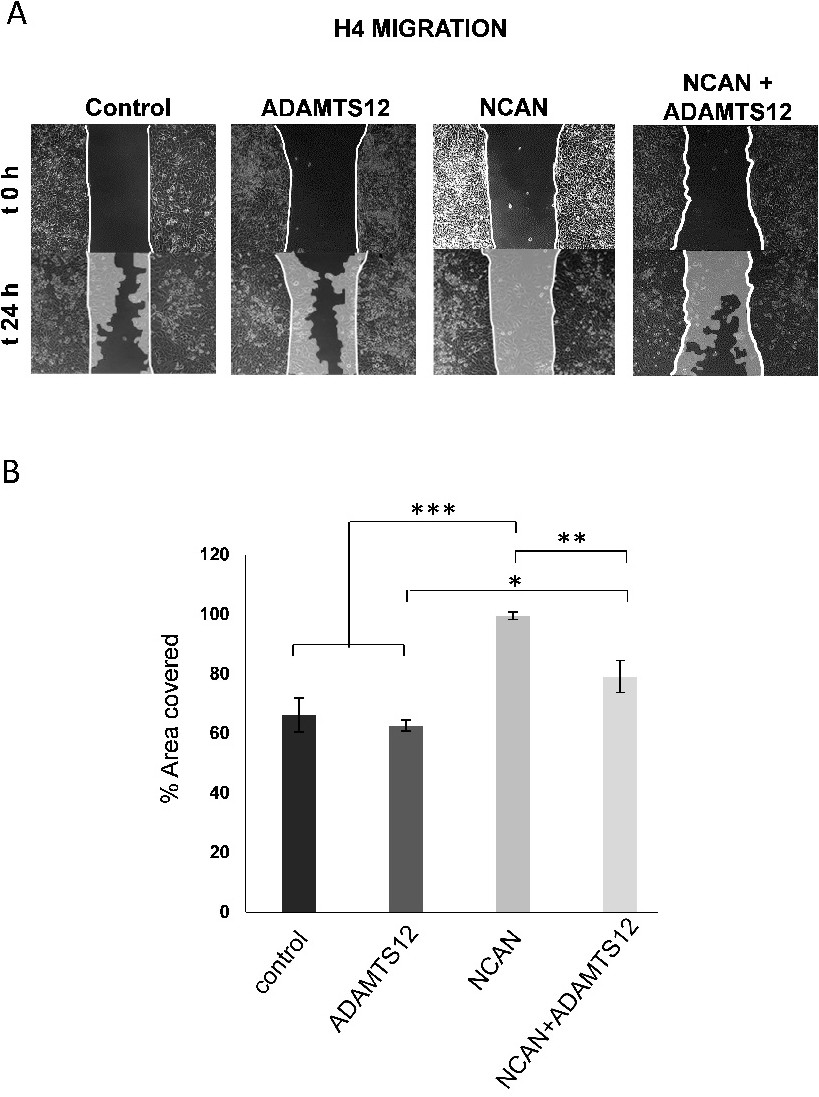
Fig. 4. Increased migration of H4 cells on neurocan. A. H4 cells were allowed to migrate in wells coated with ADAMTS12, neurocan (NCAN), or neurocan cleaved by ADAMTS12 (NCAN + ADAMTS12). A standard culture dish was employed as a control. Representative pictures of starting (t = 0 h) and final (t = 24 h) times are included. The starting points are indicated with thin lines, and migrated cells are indicated with different shadows between the starting points. B. Graphical representation of the area covered by H4 cells after 24 h from three independent experiments. *p<0.05, **p<0.01, ***p<0.005.